
pd-controller

pd-controller is the control-plane service, state model, RPC surface, remote-debug orchestration, and Web UI for pd-edge data planes.
Cargo usage
The workspace uses sibling RustScript and Edge crates during local development. For downstream Cargo manifests, use these repository references:
pd-vm = { git = "https://github.com/rustscript-lang/rustscript", package = "pd-vm" }
pd-edge = { git = "https://github.com/rustscript-lang/pd-edge", package = "pd-edge" }
pd-controller = { git = "https://github.com/rustscript-lang/pd-controller", package = "pd-controller" }
Test
cargo test --workspace
cargo build --workspace --release
Service guide
pd-controller is the control-plane server for pd-edge data planes.
It implements:
- edge RPC pull endpoint:
POST /rpc/v1/edge/poll - edge RPC result callback:
POST /rpc/v1/edge/result - admin endpoints to enqueue commands per edge (
apply_program,start_debug_session,stop_debug_session,get_health,get_metrics,get_telemetry,ping) - edge status/result query endpoints
GET /healthzandGET /metrics- embedded Web UI static serving on
/uiand/ui/*whenwebui/distis built before compiling the controller
Contents
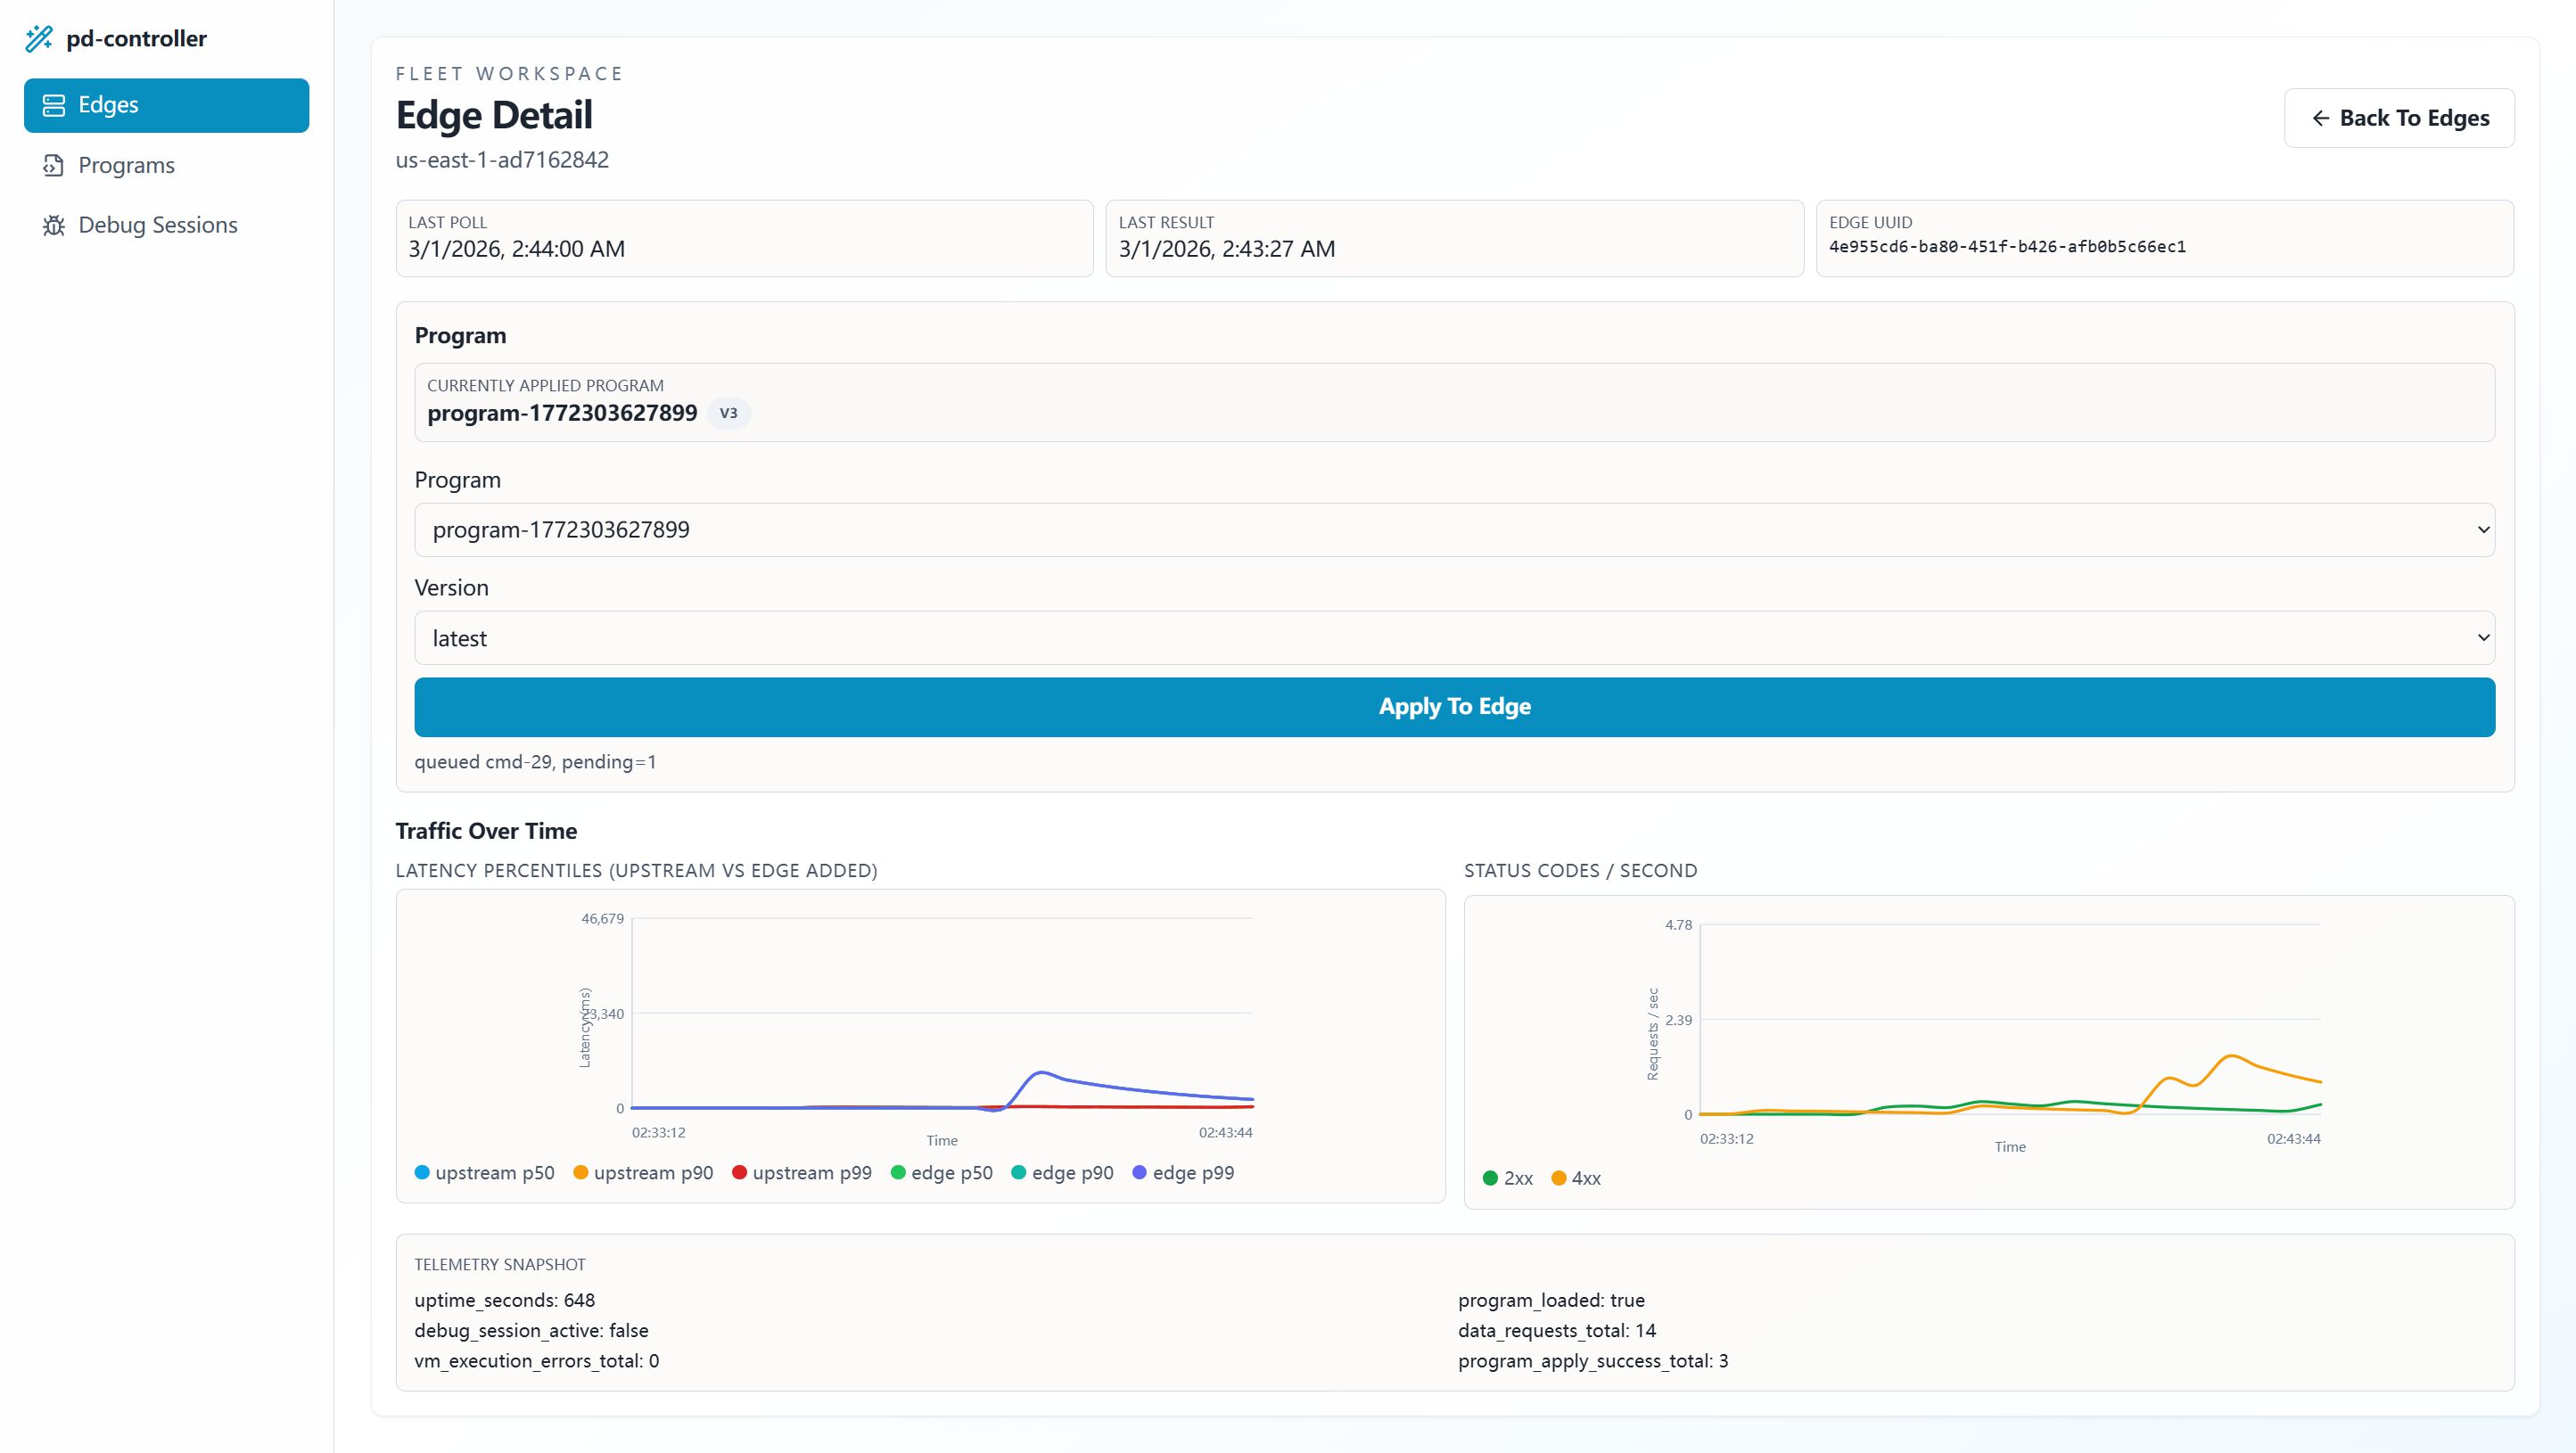
- Edge overview
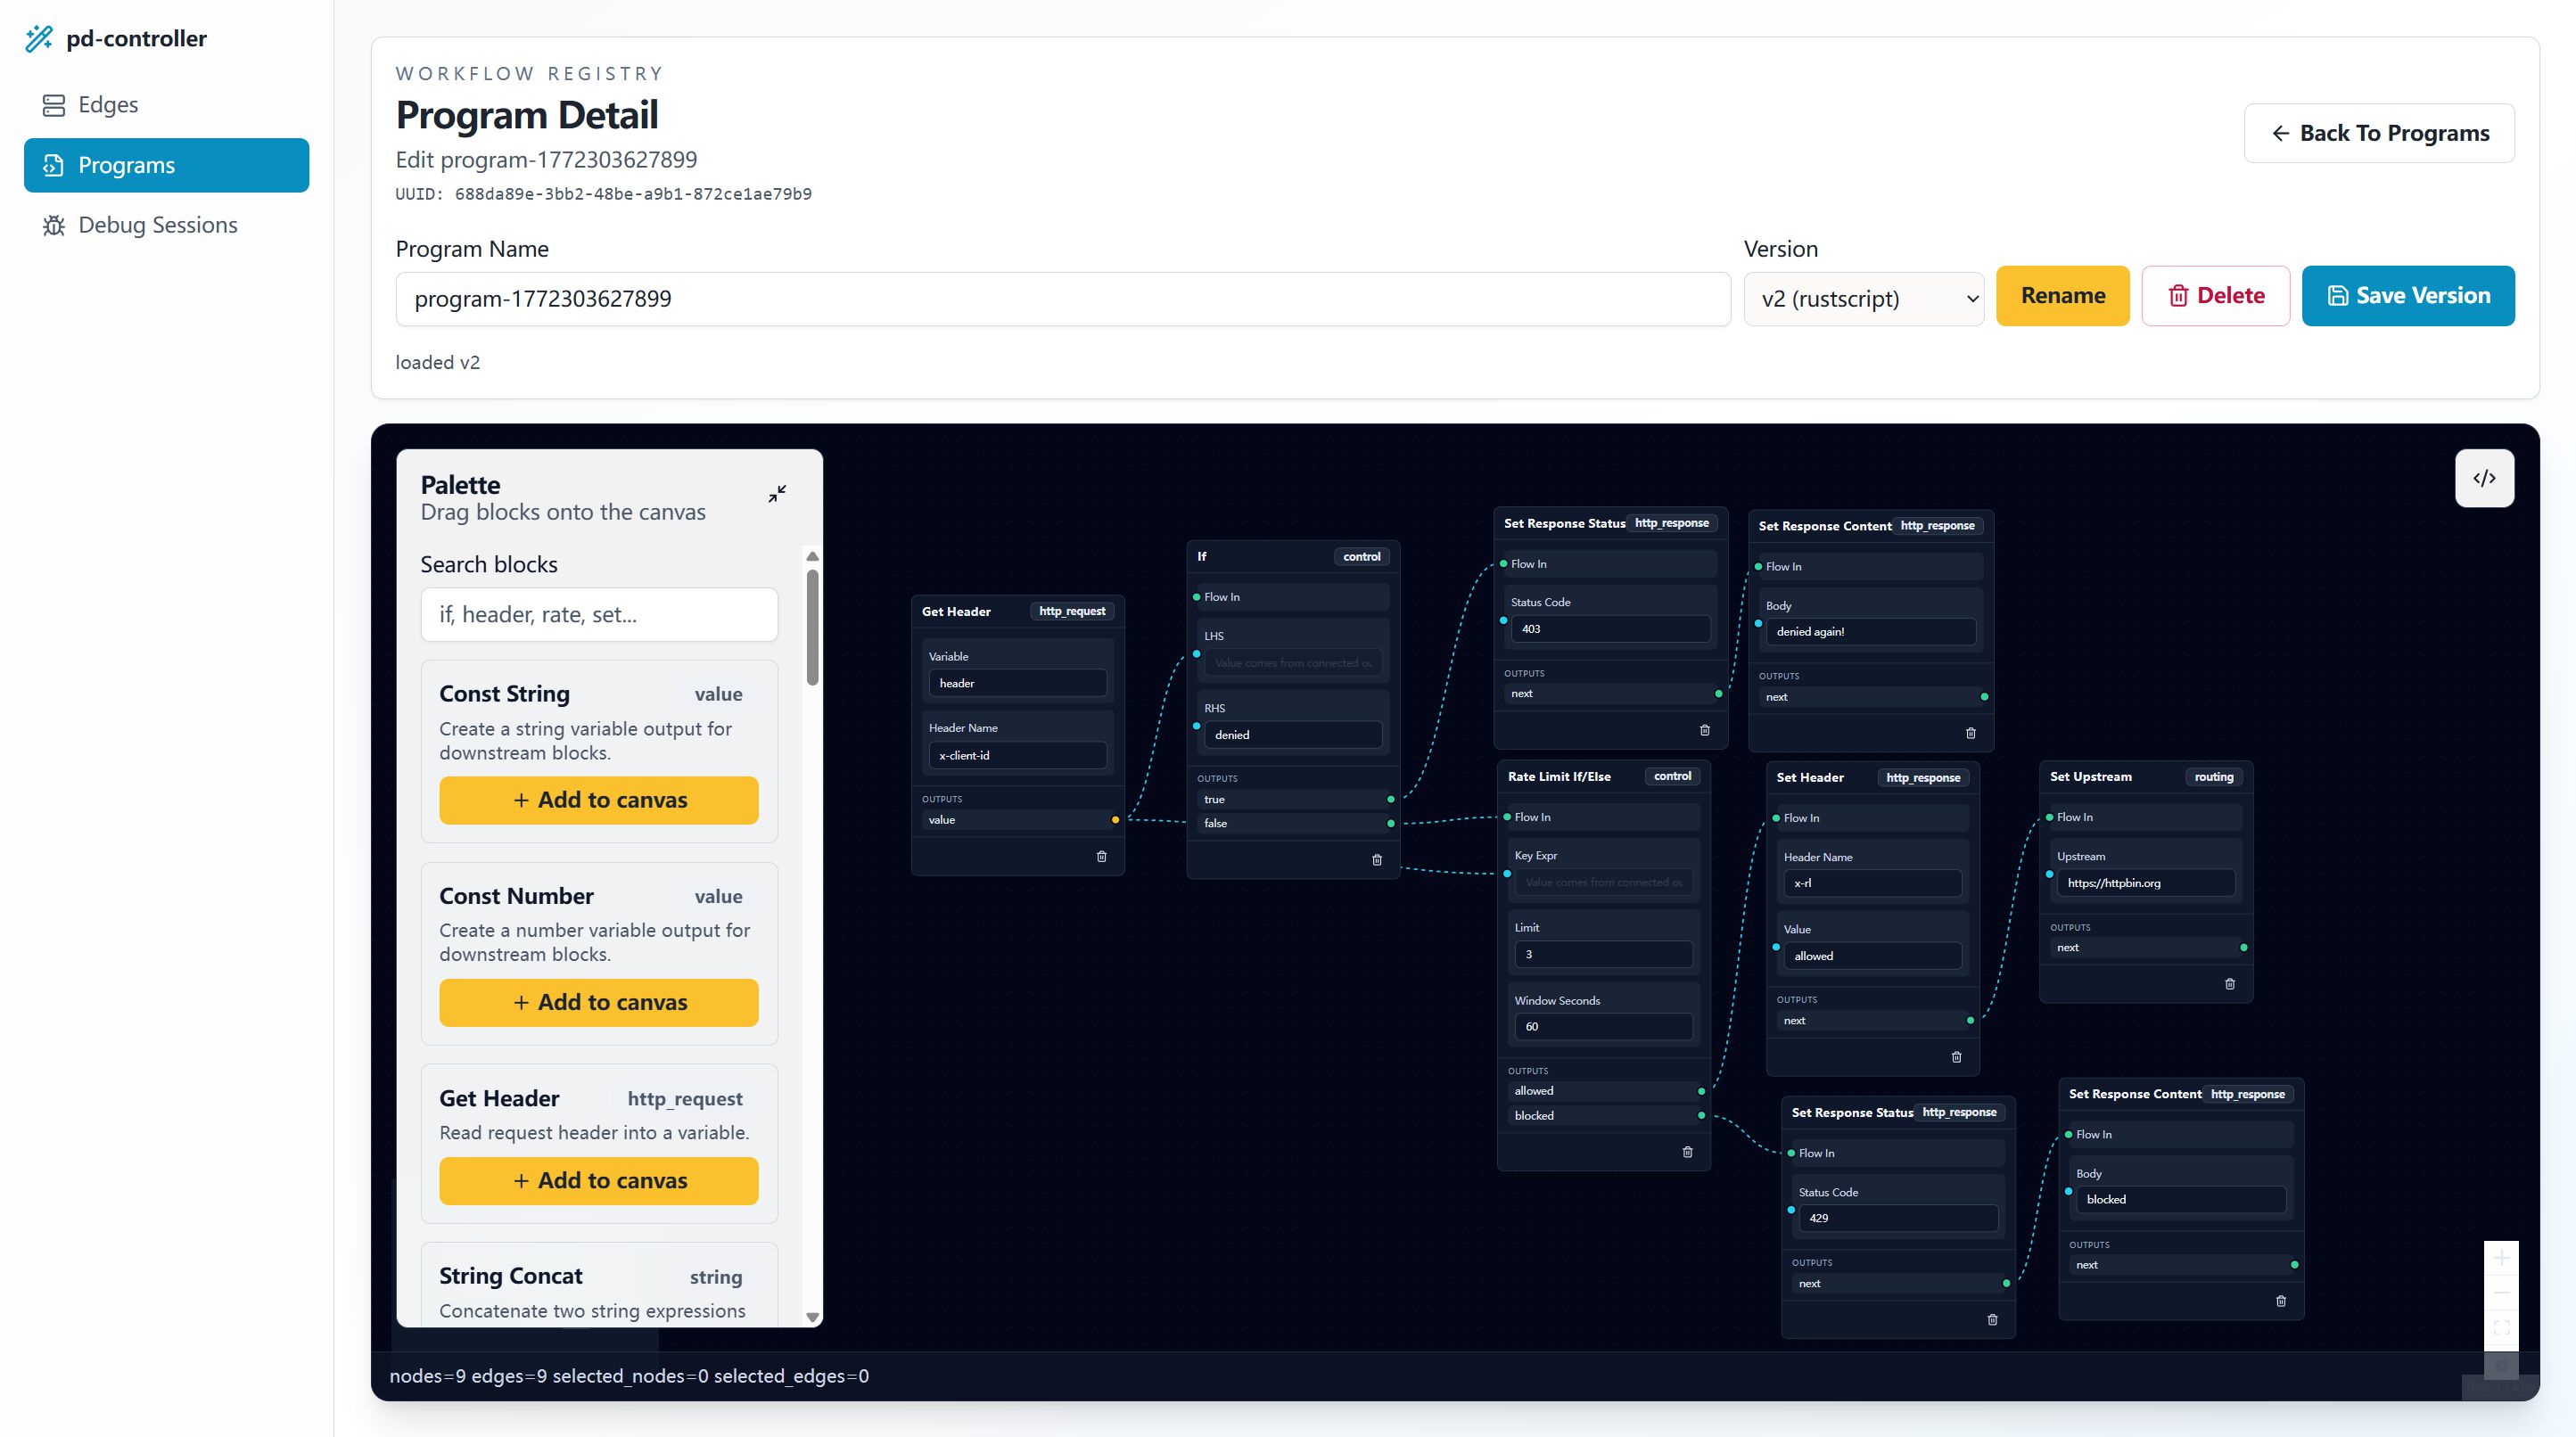
- Program management
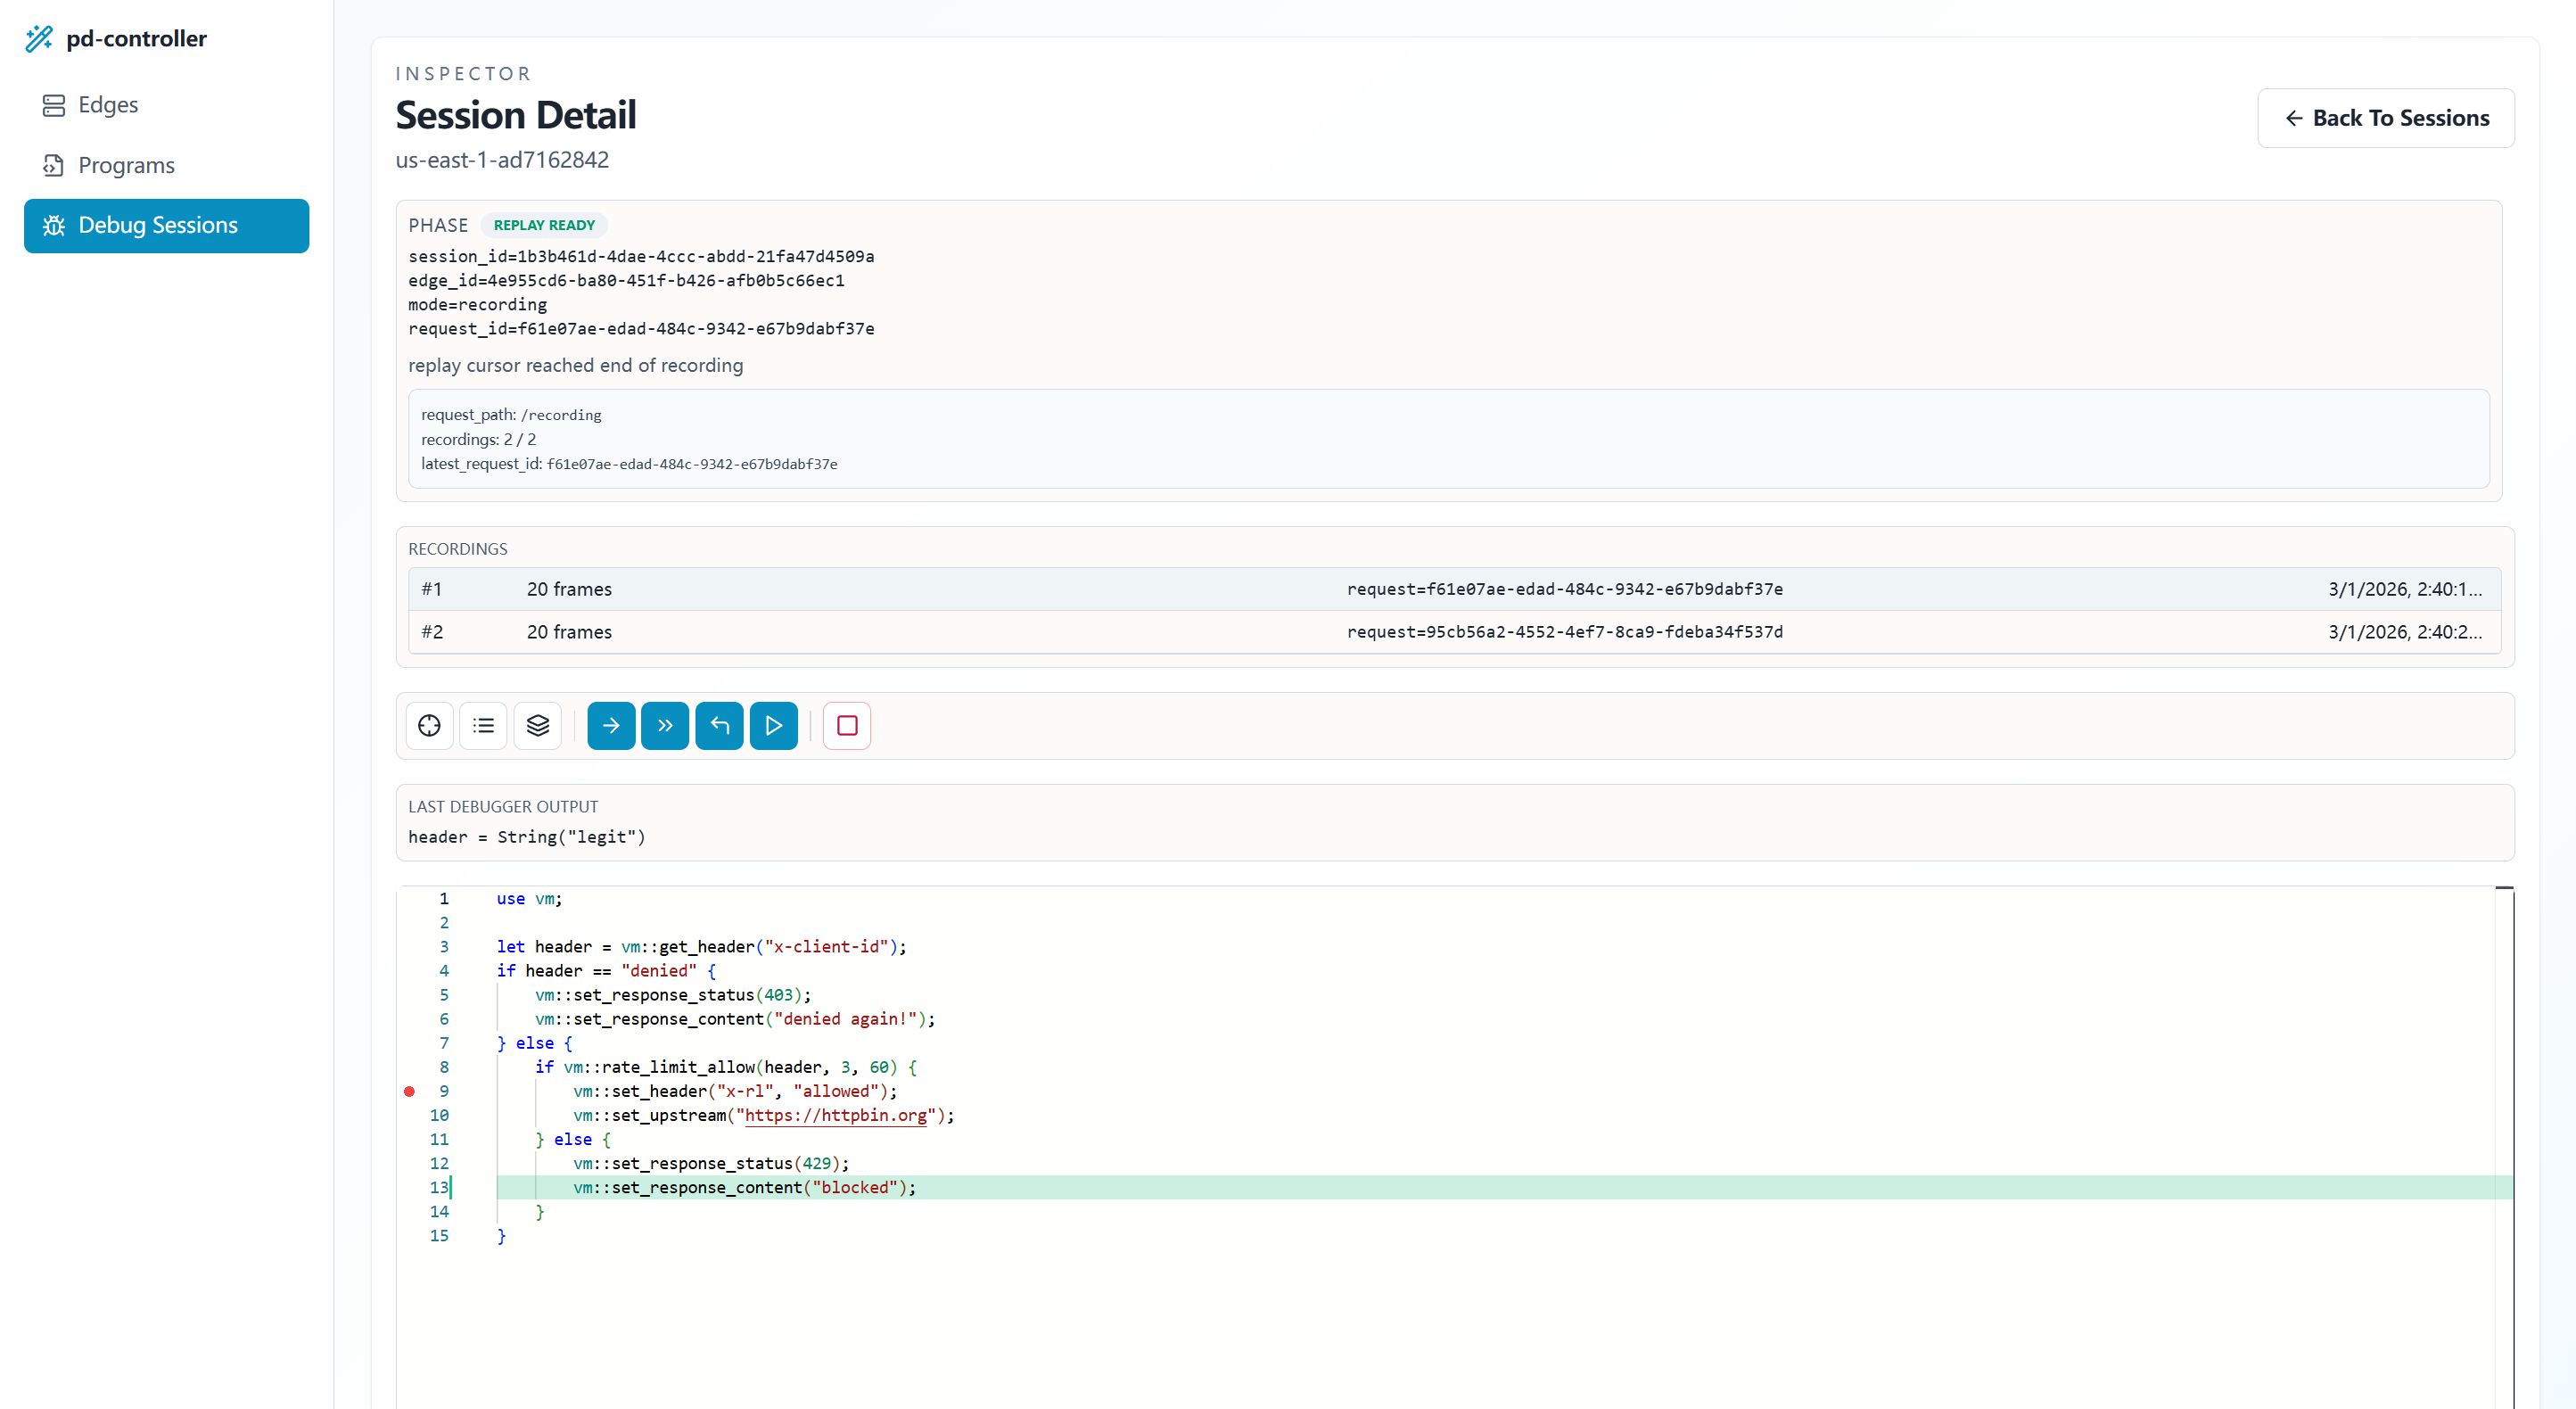
- Debugger
- Run
- Docker image
- Example: enqueue bytecode for edge edge-1
- End-to-end integration test
- Web UI
- Debug sessions in Web UI
Edge overview
Program management
Debugger
Run
cargo run -p pd-controllerDocker image
Release workflow publishes fffonion/pd-controller:<tag> and fffonion/pd-controller:latest.
Run controller with published image:
docker run --rm -p 9100:9100 fffonion/pd-controller:latestVersion metadata:
cargo run -p pd-controller -- --versionWhen the production bundle exists at webui/dist during compilation, the controller serves it from:
http://127.0.0.1:9100/ui
Env vars:
CONTROLLER_ADDR(default0.0.0.0:9100)CONTROLLER_DEFAULT_POLL_MS(default1000)CONTROLLER_MAX_RESULT_HISTORY(default200)CONTROLLER_STATE_PATH(default.pd-controller/state.json; set to empty string to disable persistence)
Persistence files (when CONTROLLER_STATE_PATH is set) are split as:
- core state:
<state_path>(edge core status + sequences) - programs:
<state_stem>.programs.json - time series:
<state_stem>.timeseries.bin(compact binary payload, smaller than JSON) - debug recordings:
<state_stem>.recordings.json - debug sessions:
<state_stem>.debug-sessions.json
Example: enqueue bytecode for edge edge-1
curl -X PUT "http://127.0.0.1:9100/v1/edges/edge-1/program" `
  -H "content-type: application/octet-stream" `
  --data-binary "@example.vmbc"
End-to-end integration test
Run the demo integration test that boots pd-controller + pd-edge, enqueues a program, and verifies edge behavior:
cargo test -p pd-controller e2e_controller_can_push_program_to_active_proxy_edgeWeb UI
The Web UI source lives in webui/ (React + shadcn components).
1. Start controller:
cargo run -p pd-controller2. Start Web UI dev server:
cd webui
bun install
bun run dev
By default, Vite proxies /v1 API calls to http://127.0.0.1:9100. You can override with VITE_CONTROLLER_URL.
To produce the embedded production UI bundle:
cd webui
bun install
bun run build
cd ..
cargo build -p pd-controller --release
UI-focused APIs exposed by controller:
GET /v1/ui/blocks(block catalog)POST /v1/ui/render(render 4 source flavors from block graph)POST /v1/ui/deploy(compile selected flavor to bytecode and enqueueapply_program)
/v1/ui/render and /v1/ui/deploy accept either:
{"nodes":[{"id":"n1","block_id":"...","values":{...}}],"edges":[{"source":"n1","source_output":"value","target":"n2","target_input":"value"}]}
- legacy linear payload:
{"blocks":[{"block_id":"...","values":{...}}]} - graph payload:
Debug sessions in Web UI
/ui debug sessions support two modes:
interactive: live edge debugger attach mode (header-triggered).recording: collects one or more full VM execution recordings for a target request path, then replays locally in controller UI.
For recording mode in UI:
1. Select Mode = Recording. 2. Set Request Path (for example /api/orders) and Record Count (default 1). 3. Start session and send matching requests to the edge. 4. Open captured recordings from the recordings sub-list in session detail. 5. Use the Monaco view and toolbar commands (where/step/next/continue/out/locals/stack/print) during replay, including hover variable inspection. 6. Compile-time diagnostics from the wasm linter, including inferred type mismatches such as incompatible if/else branches, are shown directly on the debug-session source view.